Harmful Algal Bloom in the Gulf of Mexico

For many of us living on the southern (Gulf) coast of the USA, it has become common to see numerous dead fishes floating in the bays and scattered across our beaches. Why is this happening? You may have heard on the news that there is a large harmful algal bloom (HAB) that began off the western coast of Florida and has slowly spread throughout the Gulf over the past few months. While the HABs occur somewhat regularly in Florida, it is quite rare for them to extend as far north as they have this year. The last major HAB of this particular dinoflagellate species (Karenia brevis) occurred ten years ago. The Mississippi Department of Marine Resources has been monitoring the bloom recently, and they have seen some of the negative effects of the ecosystem.

The lumpy greenish-translucent blob is Karenia brevis. These images were captured with the FlowCam, which is an instrument that images algal sized particles in a water sample.

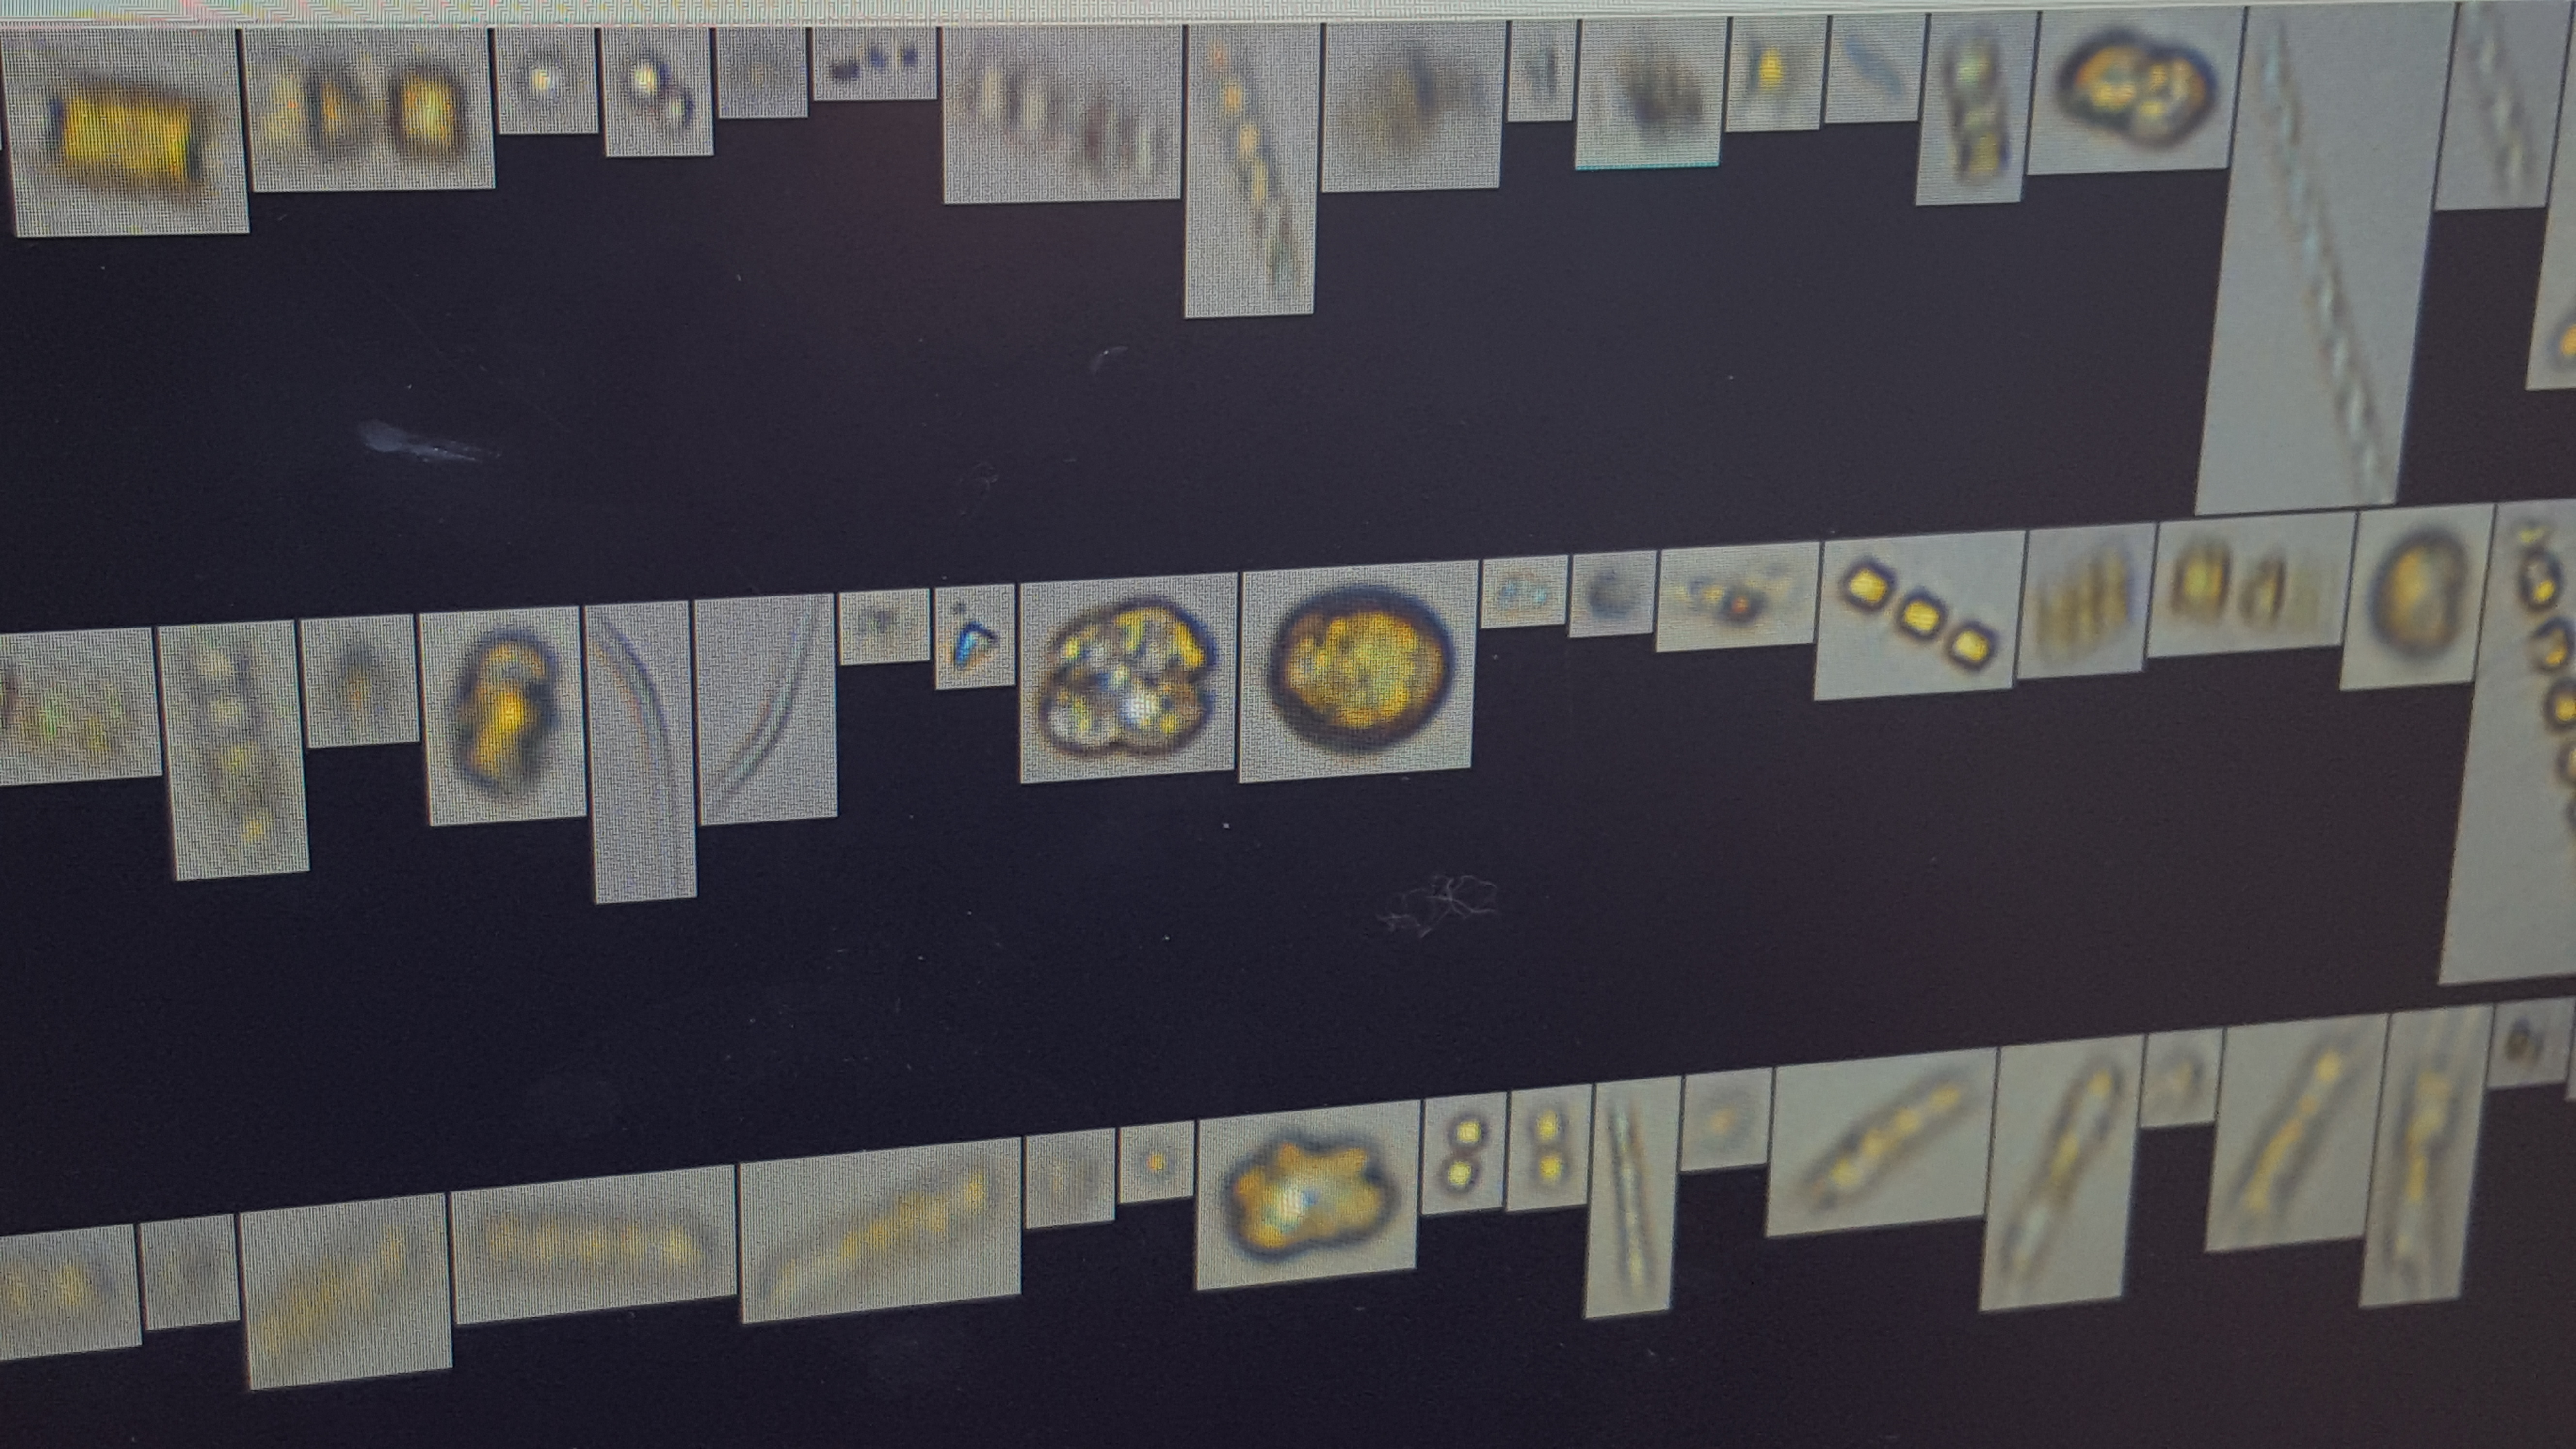
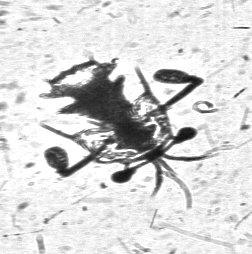
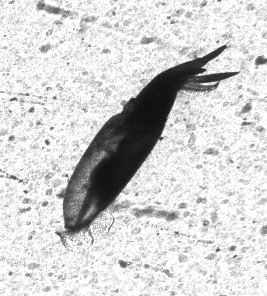
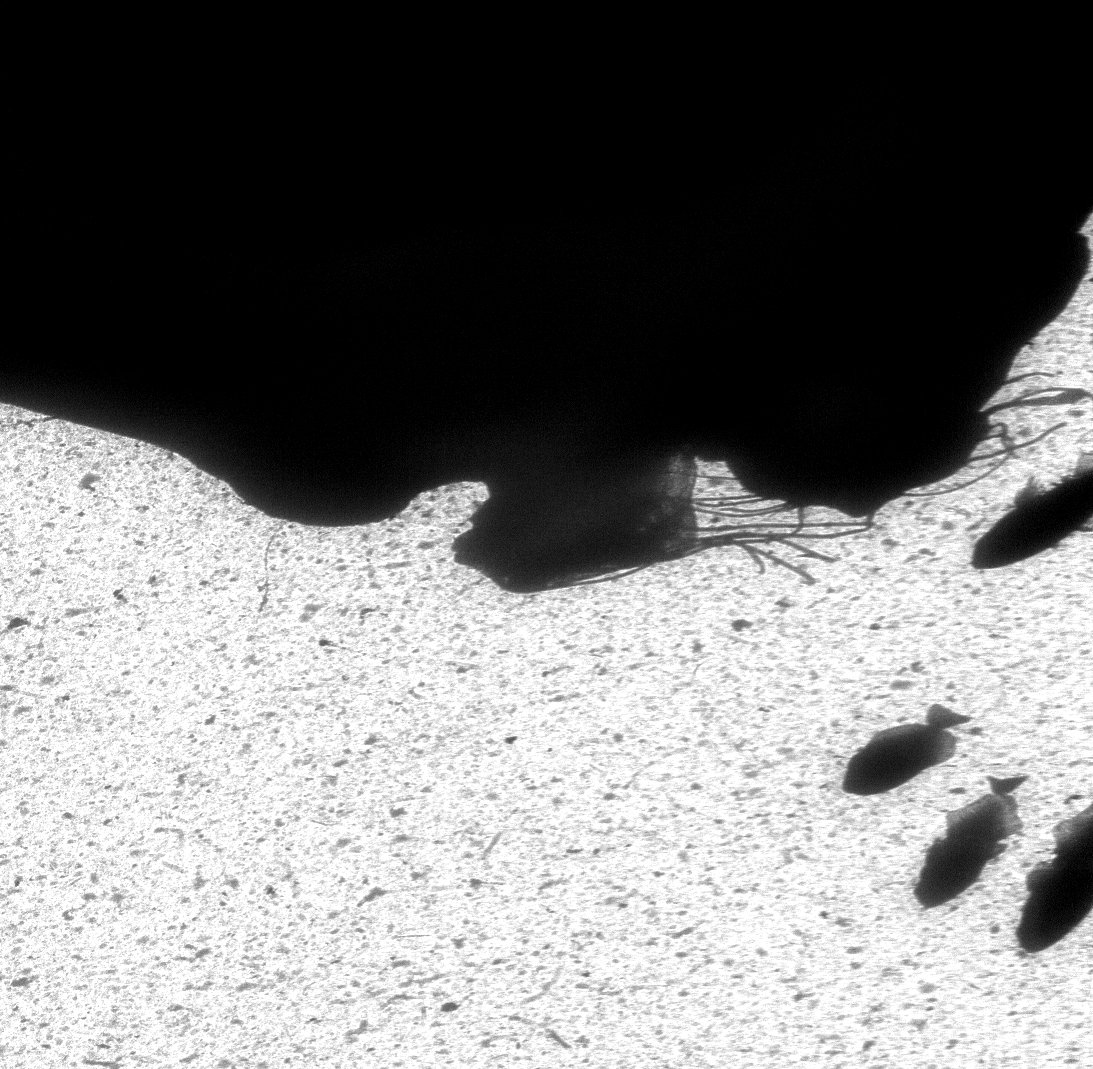
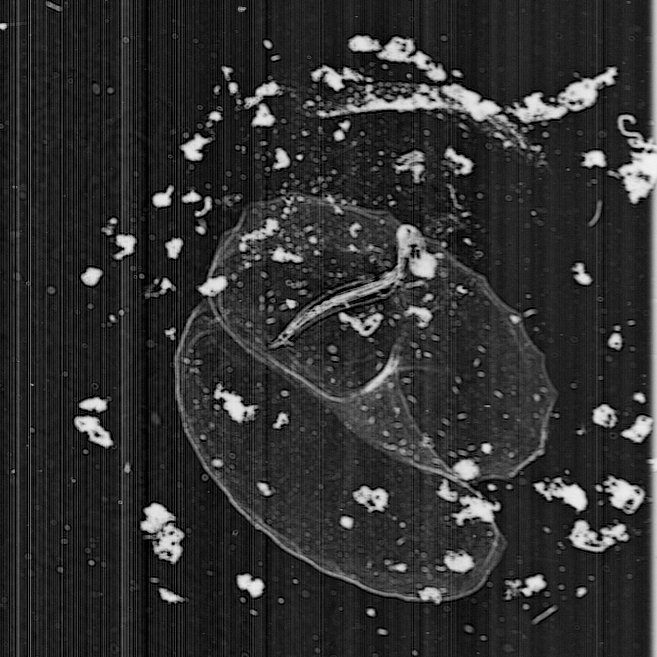
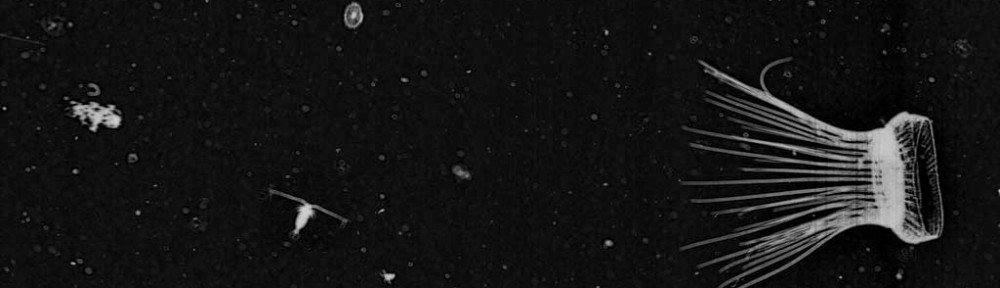
The lumpy greenish-transparent blob (near the center of the photo) is Karenia brevis. These images were captured with the FlowCam, which is an instrument that images algal sized particles in a water sample.

thousdands of deadGulf Menhaden accumulate at a front off the coast of Mississippi. Fronts concentrate floating objects by providing a convergent flow.

Thousands of dead Gulf Menhaden accumulate at a front off the coast of Mississippi. Fronts concentrate floating objects (dead fish and other debris) by providing a convergent flow (photo by Adam Greer taken on Dec. 15, 2015).

So how do these tiny plankton kill the fish that we see washing up onshore? After all, the individual phytoplankton within the HAB are only about 20 microns in size (that is 0.02 mm). Karenia brevis (a.k.a. “the red tide” derived from its brownish-red color at high concentrations) naturally produces a compound known as brevetoxin – a potent neurotoxin that inhibits sodium channels required for many neurological processes. Some of the most abundant fish species in the Gulf of Mexico are filter feeders such as Gulf Menhaden. These are commercially important fish that feed by opening their mouths and swimming to capture as much phytoplankton as they can. Karenia brevis is often present off the Florida coast, but in low abundances. Under these circumstances, Karenia brevis does not harm the fish that consume it. Only when the concentrations reach extreme levels do the fish experience the negative effects of the brevetoxin. Filter feeders like the menhaden are most directly impacted by the phytoplankton-produced toxin; however, the organisms that consume these fish are also susceptible to the harmful neurological effects. Large black drum have also been washing up onshore, presumably killed by eating too many menhaden and other fish species that had built up high levels of toxin in their tissues. Even dolphins and birds can become very sick from eating these suddenly toxic fish.

Adam Boyette runs the FlowCam to characterize the phytoplankton community and monitor the HAB

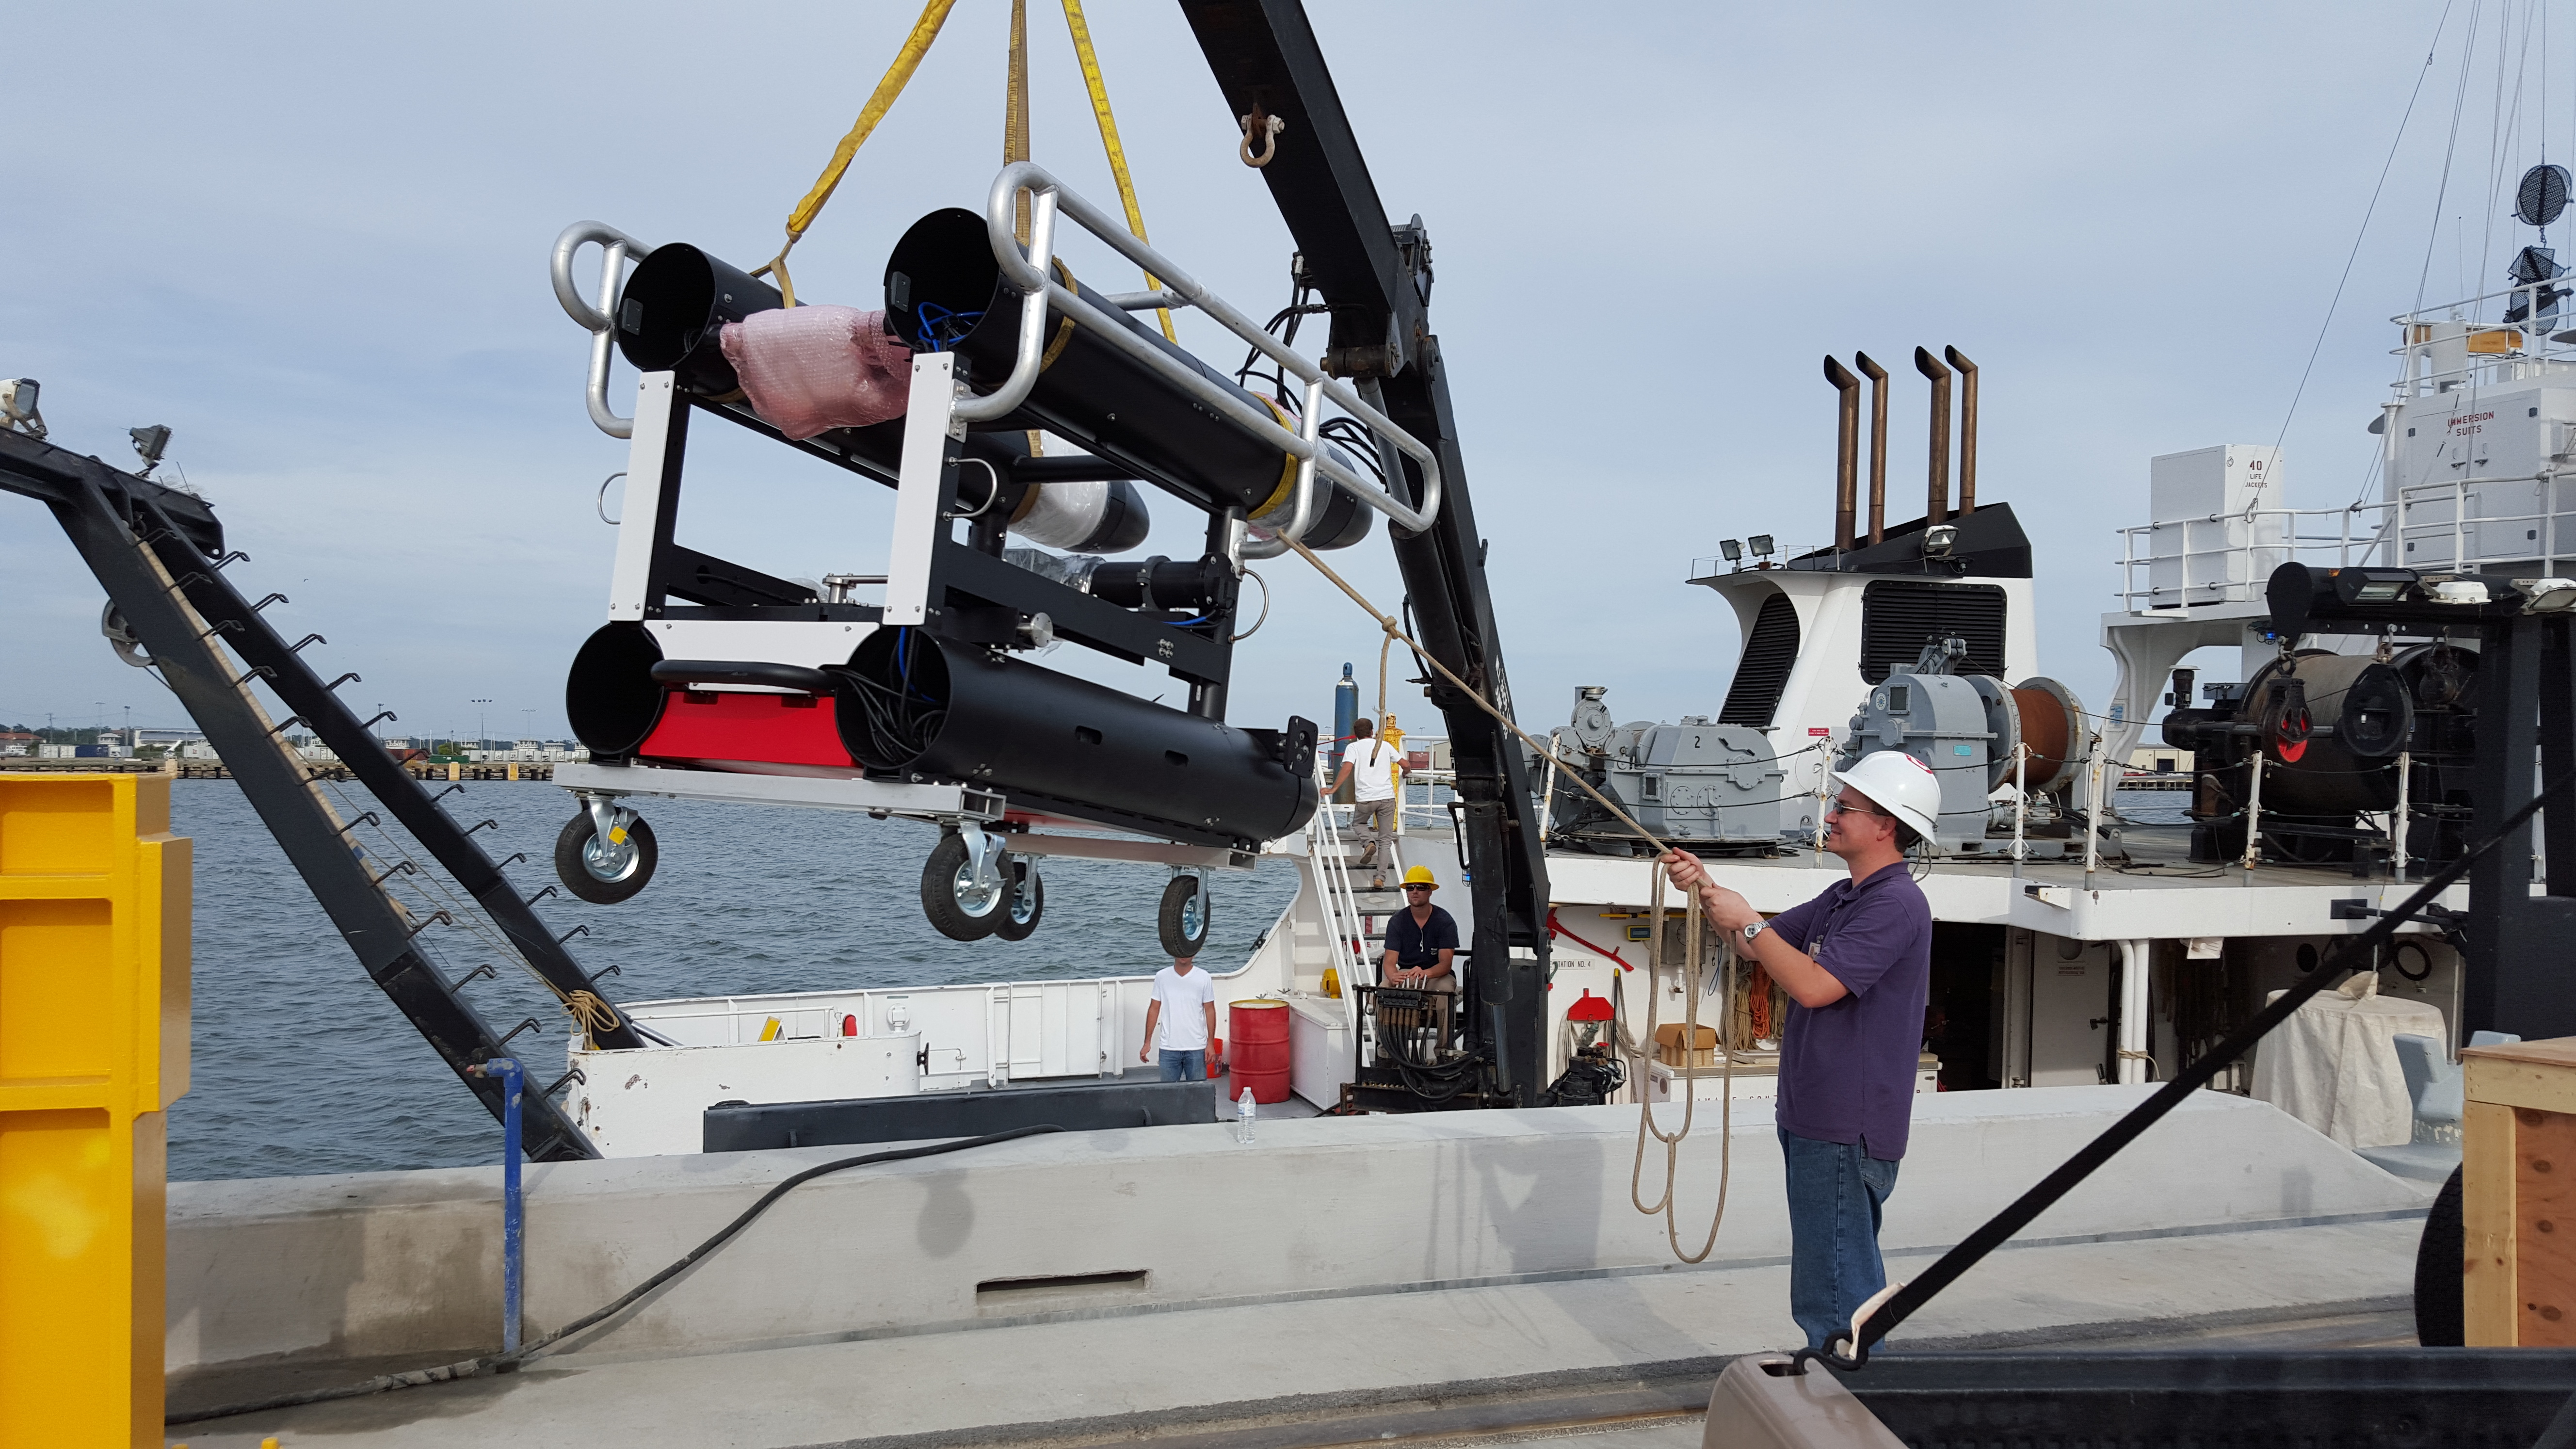
University of Southern Mississippi scientist Adam Boyette runs the FlowCam to characterize the phytoplankton community and monitor the HAB.

Why is this bloom so severe this year? While there are probably a variety of factors at play, most agree that an unusually strong El Nino is likely the primary culprit. Along the Gulf coast recently, it has been unseasonably hot and dry. The winds have also been calm. This provides ideal conditions for Karenia brevis to proliferate and form dense aggregations. With cooling temperatures, the growth rates of these phytoplankton should decrease. The increasing amounts of rain and wind recently should cause these HAB patches to break up, diluting the extreme concentrations, which will hopefully mitigate the harmful effects on Gulf of Mexico ecosystem.

1 million classifications!

Last week, Jean-Olivier and Zuzana organized a push to one million (1,000,000) classifications here at Plankton Portal in honor of my defending my PhD on Friday, October 30, 2015.

Jessica_Luo_defense_titleslide

Title slide for Jessica’s defense seminar

The PhD defense at the University of Miami essentially consists of a 1-hour public seminar on my dissertation research, which I had conducted over the last five+ years, and then a multi-hour private question-and-answer session with my  committee. In my case, my committee consisted of my advisor, Dr. Robert K. Cowen, and four other professors, Drs. Su Sponaugle, Gary Hitchcock, Rob Condon, and Jean-Olivier Irission. At the end of the private session, if the work and the answers to the questions were deemed satisfactory, then the student passes and essentially is this granted a doctorate.

So I have two happy news: 1) My PhD defense was successful – all went well! and 2) We did it! Plankton Portal reached one million classifications by the time I defended!

PP_1million

The above photo shows Professor Cowen, me (Jessica), and Cedric Guigand with ISIIS (the instrument that collects all the cool images in Plankton Portal!) on board the R/V Walton Smith on a cruise in the Florida Keys this past summer. We had taken it in anticipation of a Plankton Portal classification milestone; little did I know that it would be in conjunction with my PhD milestone!

In my PhD, I looked at gelatinous zooplankton (jellies) in marine ecosystems from three contexts: in aggregations at fronts (that’s the California current dataset on Plankton Portal!), as predators of other plankton in driving vertical migrations, and as contributors to the global carbon cycle. For the first two parts (“chapters”), I focused on small jellies, and studied them using ISIIS, and for the last chapter, I conducted a modeling study on all jellies (medusas, comb jellies, and salps/pelagic tunicates) over the global oceans. It’s been a really educational process for me, learning about jellies, imaging systems, modeling, and overall, how to do science. I’ve been able to publish one of my dissertation chapters already, and look forward to publishing the rest over the next six months. Grad school has also been a really fun opportunity for me to get out in the field (on five research cruises), go to conferences all around the world (Japan, Spain, Hawaii), help run citizen science projects like Plankton Portal, and just overall meet some incredible people who do fascinating work. It’s been a total privilege, one that I haven’t taken lightly. And I look forward with anticipation to the journey to come. Onwards and upwards!

Images from the first leg

Things are going well onboard the R/V Point Sur as we finish up the first leg of the CONCORDE fall research expedition (www.con-corde.org). Although the water column has been well mixed from the recent windy conditions, we are seeing a lot of structure with regards to the biology. As we move along the transects, we see distinct changes in the plankton community. Here are just a few examples of the types of organisms we are seeing.

Plankton_20151029132211.638.avi_13_254_252_85_234jpg

This looks like something out of an alien movie, but it actually a stomatopod larva. Stomatopods are also known as mantis shrimps and, like many ocean animals, have egg and larval stages in the plankton. Adult stomatopods can give one of the most powerful strikes of any animal for its size. They use their club-like appendages seen in the image to bash their prey, stunning or killing it before consumption. Stomatopods, with their large compound eyes, also have some of the best visual acuity for any invertebrate.

Plankton_20151102112036.823.avi_176_296_267_874_1557jpg

Today we also found this larval squid (~1 cm in size). It was imaged right next to two similarly sized squid larvae, so we can only assume that they were spawned from the same parents or spawning event (i.e., they are members of the same cohort). Many larval animals may aggregate in this fashion to protect themselves from predators. Even though aggregating together may not reduce each individual’s chance of encountering a predator, the schooling behavior probably has a benefit because predators may become confused by the many potential targets in close proximity.

Plankton_20151029103645.818.avi_69_1069_1093_955_885jpg

This last image is one that is truly exceptional. It shows a large scyphomedusa (jellyfish) that covers almost the entire image. The field of view on the ISIIS is about 13 cm, and we can estimate that this individual is at least twice that size. It is likely a moon jelly (Aurelia spp.), but the most remarkable thing are the fish larvae aggregating underneath it. We can see four larvae that appear to be jacks or butterfish that seem to be using the moon jelly for shelter or protection. Jellyfish are often thought of as predators of fish larvae, but images like this one show that that interpretation may be a bit simplistic. A few types of fish larvae are known to use jellyfish for protection because some larval fish predators avoid eating jellyfish due to their stinging nematocysts and low nutritional value. It is extremely rare to document this kind of behavior, especially the large number of larvae aggregating under one moon jelly.

Plankton Imaging Cruise in the Gulf of Mexico

Recently the University of Southern Mississippi purchased a brand new In Situ Ichthyoplankton Imaging System (ISIIS) for use as part of a research consortium known as CONCORDE (www.con-corde.org). The goal of the consortium, which involves many different universities and governmental organizations, is to better understand potential physical and biological pathways of oil in river-dominated coastal ecosystems, such as the northern Gulf of Mexico.

USM researcher Kevin Martin helps to lower the ISIIS onto the Pt. Sur

USM researcher Kevin Martin helps to lower the ISIIS onto the Pt. Sur

In order to better understand the ecosystem, we must first get an idea of how the different planktonic organisms are distributed in time and space. The ISIIS is a good tool to do this because it will ultimately provide a high resolution spatial map of different plankton taxa, which can be used to complement many avenues of oceanographic research. Currently, we are aboard the R/V Point Sur, deploying the imaging system in the nearshore environment, identifying and mapping the different types of plankton in the highly productive northern Gulf of Mexico. Because the weather has and continues to be quite windy, we are generally seeing a well mixed water column, but there still a great amount of biological diversity. Throughout the course of the research expedition, we will post updates of the different organisms being found. Here is one image of a phyllosoma larva, which is the larval form of lobsters. This is possibly a slipper lobster, which is known to have a larval stage of over 9 months! These organisms must undergo incredibly long and dangerous ocean journeys in their first few months of life, as they traverse the coastal waters that are full of predators. We were lucky enough to come across this one:

Phyllosoma larva are almost completely transparent and have remarkably long larval stages

Phyllosoma larvae are almost completely transparent and have remarkably long larval stages. This one is only ~2 cm long but could eventually develop into an adult lobster if it survives the perilous journey in the plankton.

For more updates on the research being done on the Point Sur, please follow Heather Dippold’s CONCORDE blog at www.con-corde.org/blog. There you can see information about the different instruments and people involved in studying various aspects of oceanography in the Gulf of Mexico. Also, stay tuned here to see different types of plankton we are finding in the images!

Gulf of Mexico “Dead Zone”

Each year, scientists in the northern Gulf of Mexico measure the size of the “dead zone,” which is an area where the bottom waters contain oxygen levels below 2.0 mL oxygen per L of water. This is a commonly identified threshold below which many zooplankton and fishes cannot survive. The states along the Gulf of Mexico rely on productive coastal fisheries, and for bottom associated species like shrimp and crabs, a larger “dead zone” means less habitat. This year’s dead zone is exceptionally large (6,400 square miles), leading many people to believe that something or someone is to blame. In reality, there are many interacting factors that cause the large dead zone.

18472203-mmmain

To understand why the dead zone is so large, we must first understand why it forms. The dead zone has been forming in the Gulf of Mexico for centuries, but only in the last few decades has the dead zone dramatically increased in size and severity of hypoxia (low oxygen conditions). For a dead zone to form, two basic conditions have to be met: 1) there must be high freshwater runoff through river input (a supply of nutrients), and 2) there must be strong thermal stratification. During the summer months, the southeastern USA experiences high amounts of rainfall, which leads to increased river flow into the Gulf of Mexico. The summers are also extremely hot, so the sun’s radiation heats the surface layers of water more than the deeper layers. This thermal heating suppresses vertical mixing, which makes it difficult for the deeper waters near the bottom to re-equilibrate with the atmosphere.

When the freshwater enters the Gulf of Mexico, it supplies nutrients to the phytoplankton, leading to a bloom where they take up carbon dioxide for photosynthesis and produce oxygen. These phytoplankton, however, have short life spans (~2-4 weeks), so they die shortly after the bloom. When the phytoplankton die, they sink to the bottom of the Gulf of Mexico and are then broken down by bacteria. These bacteria use the available oxygen in the deeper waters to break down the dead phytoplankton, ultimately leading to hypoxic conditions and the formation of a “dead zone.” The intense summer sun suppresses the vertical mixing by keeping the surface waters much hotter than the low oxygen bottom waters. Large storms or wind events (i.e., hurricanes) can actually reduce the size of the dead zone because the winds promote mixing of the water column, allowing the low oxygen bottom waters to reach the air-sea interface and once again become saturated with oxygen.

deadzone

So why is the dead zone so large in 2015? For one, we are experiencing an extremely strong el Nino year. For the southeast USA, el Nino leads to high amounts of rainfall but poor conditions for hurricanes due to wind shear in the upper atmosphere. The combination of high rainfall but few hurricanes is favorable for a large dead zone. The consistently large dead zone documented in recent years appears to be predominantly due to farming practices that rely on large amounts of fertilizers, which ultimately end up in the rivers feeding into the Mississippi River and Gulf of Mexico. Because most of our gasoline now contains ~10% corn-derived ethanol, there is currently a huge incentive for farmers to grow corn. The problem is that corn is a crop that requires large amounts of nitrogen-based fertilizers that eventually end up in the Gulf of Mexico, providing fuel for the phytoplankton blooms that cause hypoxia. There is also some evidence that the Gulf of Mexico may have experienced a regime shift in the plankton and microbial communities that make the ecosystem more responsive to nutrient input changes (Dale et al. 2010).

The problem of the Gulf of Mexico dead zone is a perfect illustration of how oceanography is souch an interdisciplinary science. To understand why and how the dead zone forms, we must consider physics, climatology, biology, and even public policy which influences nutrient supply into our rivers. Fixing the problem of the Gulf of Mexico dead zone will require cooperation among many different interest groups, but some of the factors that influence the size of the dead zone are out of our control. Substantially reducing nutrient runoff into our rivers is an achievable goal that could help alleviate the stress on the ecosystem by reducing the size of the dead zone.

References:

Dale, V.H., Kling, C.L., Meyer, J.L, et al. (2010) Hypoxia in the Northern Gulf of Mexico. Springer. New York. 284 pp.

http://www.nola.com/environment/index.ssf/2015/08/2015_gulf_dead_zone_larger_tha.html#incart_river

Announcing Plankton Portal 2.0!

There is a new dataset on PlanktonPortal!

In summer 2013, a group from the original science team behind PlanktonPortal (Bob Cowen, Cédric Guigand, and Jessica Luo) teamed up with French colleagues (Jean-Olivier Irisson, Robin Faillettaz and other members of the Laboratoire d’Océanographie de Villefranche) through a Partner University Fund-sponsored project. We roamed the Mediterranean sea, equipped with ISIIS, the instrument which takes the images seen on PlanktonPortal, and a collection of other sensors. Our aim was to understand how physical discontinuities in the ocean (such as the strong coastal current along the French Riviera) influence the plankton. These discontinuities often create conditions in which plankton thrives and this has important consequences down the rest of the food chain.

loading-isiis-3_img

Bob, and Jean-Olivier (in the background), ready to load ISIIS on the Tethys II oceanographic ship in Nice’s harbour

loading-isiis-10_img

Cédric setting his baby up with the crew of the NO Tethys II

After a rocky start (see our project blog), we eventually managed to get almost five full days of sampling. Five days; it seems short. And ISIIS was actually acquiring data of scientific interest during only 93 h within those five days. That is 3.8 full days, which seems even shorter. But that amounts to about 17.5TB of data (terabytes, as in 1024 gigabytes). In terms of images, that represents 19 trillion pixels, which could be divided into 34 million PlanktonPortal frames. So, clearly, we need your help!

We actually spent much of the last two years processing the images and classifying organisms in a small fraction of them, to be able to filter out most frames with no organisms using computer algorithms. Now we are ready. Ready with a few hundred thousands frames from the last two days of the cruise that no one has seen before and in which you can help us identify plankton.

isiis-2_img

ISIIS in font of a Mediterranean sunset

Plankton featured in Science!

Many of you may have noticed a few popular news sites mentioning plankton (see the New Yorker and Time magazine for some examples). These are popping up everywhere because of a new special issue of Science magazine including 5 research articles relating to an unprecedented global study of marine plankton biodiversity.

The cover of a special issue in Science

The cover of a special issue in Science

The issue has scientific publications resulting from a four year study aboard the research schooner Tara, in which 210 sites were sampled in all major oceanic regions. The sampling primarily focused on the upper 200 m (the euphotic zone) where most plankton biomass is concentrated. They also used satellite imagery, which can detect circulation features and temperature changes often associated with eddies and fronts. These small scale features are considered “hotspots” of biological activity, so understanding the biodiversity in these areas is particularly interesting to scientists.

Tara

The research schooner Tara was used to study plankton ecosystems around the world

There are two main reasons why these studies are garnering so much attention. First, the studies shed light onto the unknown genetic diversity in the microbial and viral ocean communities through the use of genome sequencing and analysis technology.
These microbial communities are the workhorses in the ocean, and understanding what causes microbial communities to change can help us better understand ocean ecosystem productivity and various components of carbon and nitrogen cycling. The viruses and microbes can also interact in complex ways to affect microbial community composition. The second major contribution is simply the impressive global extent of the study, which required international collaboration. Because of the spatial coverage of the study, the gene reference catalog and census of marine biodiversity across planktonic organisms will be useful for researchers all over the world. This highlights the importance of international and cross-disciplinary collaboration to study something as big and complex as the ocean.

Most of the zooplankton we have examined on this site (with the imaging system) has been what scientists call “mesozooplankton” – typically 500 microns to several centimeters in size. The Tara expedition made major contributions to our understanding of much smaller organisms, but it is important to remember that all of the ocean organisms are interconnected, and scientists are just scratching the surface of understanding these interactions and how they could affect everything from fisheries to global climate. It is an exciting time for any researcher when his or her study topic is featured in a journal as widely read as Science!

Appendicularians – putting mucus to good use

Appendicularians (also known as larvaceans) are unique animals that resemble tadpoles in shape. Unlike tadpoles, however, they do not metamorphose into a different form, but spend their entire lives as part of the zooplankton. Many marine animals use mucus for various purposes, but for appendicularians, mucus is necessary for them to feed and survive. They use mucus to build an intricate “house” that has a tunnel through the middle. The appendicularian beats its strong tail to create a current through the house, and the house collects the food particles in the water. It really is a special thing to be able to see an appendicularian inside of its house because most collection techniques destroy these houses. Even when someone does have access to an intact appendicularian house, it can be extremely difficult to view under a microscope, as documented here.

Appendicularians use a create a feeding current to filter food particles from the surrounding water. Source: http://www.microscopy-uk.org.uk/mag/indexmag.html?http://www.microscopy-uk.org.uk/mag/artjan01/oiko.html

Appendicularians create a feeding current to filter food particles from the surrounding water. The dotted arrows indicate the direction of the current through the house.
Source: http://www.microscopy-uk.org.uk/mag/indexmag.html?http://www.microscopy-uk.org.uk/mag/artjan01/oiko.html

If the housed appendicularian encounters waters that have food concentrations that are too high, the filter will clog, and the appendicularian must abandon its house. In order to keep feeding, it has to start from scratch and build a new house. Most appendicularians are thought to abandon and build several houses per day. For this reason, you see appendicularians in the ISIIS images that look as if they have no house (likely in the process of building a new one) or have fully formed mucous houses. Oftentimes you will see abandoned houses that appear slightly degraded, drifting slowly through the water column. Scientists think that these abandoned houses, which stick to all sorts of different particles causing them to increase in size and sinking speed, make up a large portion of organic material sinking through the water column (known as “marine snow”).

This appendicularian has a house that appears to be accumulating many particle on the outside. It will likely abandon this one soon and start building a new house.

This appendicularian has a house that appears to be accumulating many particles on the outside. It will likely abandon this one soon and start building a new house.

copepodemptyhouse2

The faded mucous material below this copepod is what remains of an appendicularian house. Other zooplankton might scavenge the food particles that collect on abandoned mucous houses as they sink into the deep ocean.

Not only are appendicularians responsible for creating marine snow that exports carbon to deeper waters, but they are also important food sources for the early life stages of some commercially important fishes. In fact, research in the Cowen Lab demonstrated that many tropical tunas (little tunny, yellowfin tuna, skipjack tuna, etc.) feed almost exclusively on appendicularians as larvae, before beginning to consume other larval fishes once they reach a certain size (Llopiz et al. 2010).

Many people also also surprised to learn that humans and appendicularians are classified under the same phylum (Chordata). This means that a few hundred million years ago, there was an animal living in the ocean that became the first organism to have a notochord as part of its developmental process. This ancestor gave rise to the fishes, which proliferated during the Devonian, and later all other animals that have backbones. Humans, modern reptiles, and appendicularians are all different end points on the tree of life that emerged from this common ancestor.

Reference:

Llopiz, J.K., Richardson, D.E., Shiroza, A., Smith, S.L., Cowen, R.K.,2010. Distinctions in the diets and distributions of larval tunas and the important role of appendicularians. Limnol. Oceanogr. 55, 983-996.

Plankton Pioneers

A substantial part of being a scientist, especially when you are relatively new, is learning about the research that has been done over the years. The purpose of this is to critically examine the published scientific work and identify the knowledge gaps that still remain. On this blog, we talk a lot about plankton images and all of the interesting data that you are helping us analyze. But what got us started down this path? How did scientists realize that there was a completely different world other plankton samplers (nets) were missing?

With improvements in SCUBA diving gear and underwater photography, the 1970s were an exciting time to be a marine biologist. A handful of young scientists, who would later become some of the leading experts in their field, pioneered the use of “blue water diving.” This involves divers going out to the open ocean, descending to a particular depth, and observing the life around them. Blue water diving is little bit more difficult than your typical dive on a coral reef because there is no reference point for your eye to detect if you are ascending or descending in the water. They had to be very good at controlling their buoyancy!

Dr. Alice Alldrege, now a professor at UC Santa Barbara, counts plankton within a fixed volume to estimate their concentrations

Alice Alldredge, a research professor at UC Santa Barbara, counts plankton within a fixed volume to estimate their concentrations

The amazing things the scientists witnessed, and that many of you get to see in the ISIIS images, were documented in an article in National Geographic in 1974, written by Dr. William Hamner. The article effectively captures the sense of wonder and amazement that they experienced observing these fragile animals up close. They departed from Bimini, Bahamas and would dive on the side of the island protected from the strong Gulf Stream current. Each researcher focused on a different plankton group, capturing a variety of specimens and estimating their abundance. During their research, they were the first people to image larvaceans swimming freely in the ocean, as well as discovering abundant pteropods once thought to be very rare. They even occasionally saw curious sharks passing by!

Hamner1974pic2

Salp reproducing a new chain asexually – photo credit LP Madin

Ctenophore ocyropsis maculata with its lobes open.. The scientists discovered that this species uses its lobes primarily for locomotion

Ctenophore Ocyropsis maculata with its lobes open. The scientists discovered that this species uses its lobes primarily for locomotion.

The data gathered by these “Plankton Pioneers” was so valuable that later, when computer technology advanced, their work provided justification for developing imaging systems, such as the Video Plankton Recorder (Davis et al. 1992) and ISIIS, that could collect data at a much faster rate than divers. No doubt that as technology advances even more, there will be plenty of discoveries made about the secret lives of plankton. So if you ever have a chance to be in the ocean, take a minute to ignore the pretty corals and fish to look just a few inches in front of your mask. You just might see a whole world most overlooked for so long.

All photos are from National Geographic. Head to your local library and read the entire article! It is definitely worth the trip!

References:

Davis CS, Gallager SM, Solow AR (1992) Microaggregations of oceanic plankton observed by towed video microscopy. Science 257: 230-232

Hamner, WM (Oct. 1974) Ghosts of the Gulf Stream: Blue-water plankton. National Geographic Magazine 146: 530-545

OSTRICH cruise leg 2 almost done!

We have been zigzagging up and down the Florida Straits for the last two weeks. This photo, from two days ago, shows our ship track (in blue) and drifter track (in red).

RV Walton Smith Tracks

Our first study was the Spatial Study, where we deployed a drifter at the beginning of the day, and then followed it, sampling with ISIIS and MOCNESS in a zig-zag track for the whole day. We started our cruise sampling near Miami and Bimini, Bahamas, and finished up the Spatial Study in the FL Keys.

Photo by Cedric Guigand, taken with a Phantom DJI drone

Research Vessel F.G. Walton Smith during the OSTRICH Cruise, June 2014. Photo by Cedric Guigand, taken with a Phantom DJI drone.


In the second leg of our cruise (which concludes tonight), we have been sampling in the Lagrangian Study, which lasted a total of 4 days. We deployed a drifter in the Lower Keys at the beginning of the study and have been following it continuously, sampling with ISIIS and MOCNESS.

The idea is that by following a drifter, we will be continuously sampling the same body of water. Consider this analogy: you are sampling a fast moving stream. If you stand at a fixed point on land and continuously sample, you sample different parts of the stream because it is constantly flowing in front of you. However, if you build a raft and float down the stream with it, sampling along the way, then you are actually sampling the same part of the stream at different points in time. The latter case is what we are doing. The Gulf Stream / Florida Current is our fast moving “stream” and we are drifting with the stream in a fancy raft, sampling along the way.

R/V F.G. Walton Smith, aerial view of the back deck, with ISIIS on board. Photo by Cedric Guigand

Continue following our updates on the ISIIS Facebook page as we conclude our 18-day cruise this week.