Blog post by Jean-Olivier Irisson
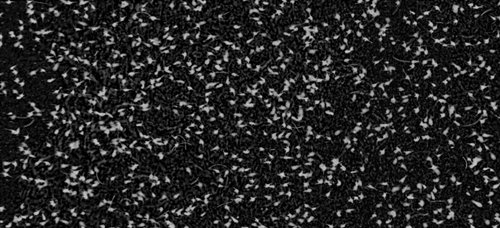
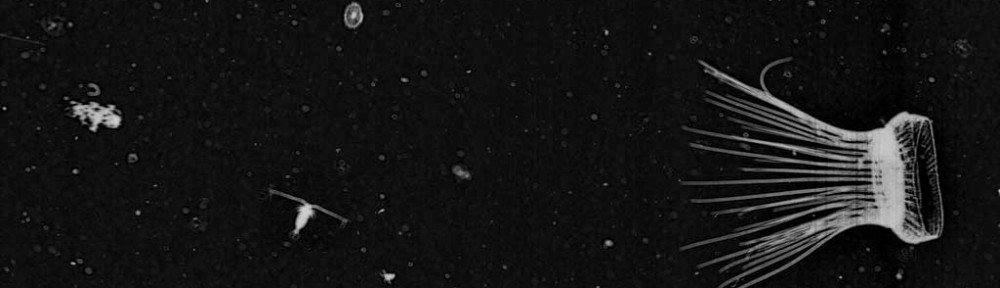
A year ago, we announced Plankton Portal 2.0, which featured a more streamlined design, a simpler tagging interface, and most importantly, a whole new dataset. Since then, this new data from the Mediterranean Sea has spurred a lot of interest and plenty of new questions. Participants on the site were surprised by the difference in size of everyone’s favourite jellies, the Solmarisidae (Solmaris rhodoloma in California, Solmissus albescens in the Med), which are much larger! Siphonophores also seem more abundant there. And the Mediterraean data came with brand new categories of organisms to mark: nice and cute medusa ephyrae (i.e. baby jellies), elegant Pteropods and the elusive fish larvae.
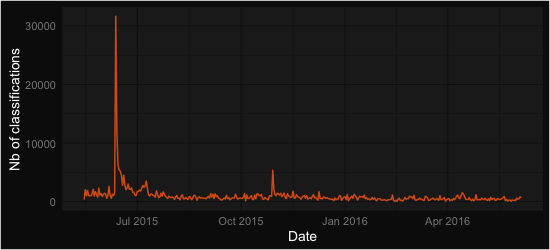
In total, as of last Sunday, 368,361 organisms were marked, on 50,519 distinct images. Through time, the classifications were marked by two peaks in activity: a huge one when the new version was announced through a mailing to the Zooniverse community (thanks everyone!) and another one when we pushed for 1,000,000 classifications in total, to celebrate Jessica’s PhD defense. When we zoom in, we see activity fluctuating around 1000 and now 500 classifications per day. This is still great (but coming back to 1000 would be even better! 😉 ).

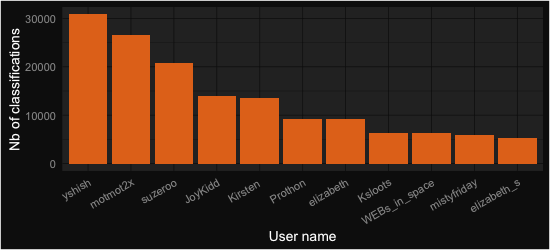
The top 11 contributors, all authors of over 5000 classifications each, are displayed below. If you made this top 11, we owe you special thanks (and probably a beer too). We hope you will stay interested and involved in this project. If you did not, you should really not be disappointed because all other volunteers still collectively account for 60% of the classifications; so you matter very much! Hopefully all of you will be happy to see some of the outcome of your work below.
Time for a bit of science! The most common classification was… nothing, empty, zero, zlich, zip… Well, you get the idea. Indeed, when we film the sea, we most often see nothing (nothing living at least). Even though we pre-selected potentially interesting frames for Plankton Portal (the ones having some kind of large object in them), about a third of your classifications did not contain any organism we were interested in. In real life, the proportion of dead detritus vs. living organisms is more around 95% vs. 5%, so our pre-filtering still avoided you a lot of blank frames! In terms of organisms, the 10 most abundant are shown in the figure below.

Doliolids, Copepods, and Radiolarian colonies dominate the rest. We immediately noticed, when we shot the images, that Doliolids were particularly abundant. Those organisms are very effective filtering machines and they may therefore have an impact on the density of smaller organisms, in particular unicellular algae. The relative abundance of Copepods and Radiolarian colonies is to be interpreted carefully: Radiolarian colonies can be large and span several frames (therefore increasing the total count) and Copepods are likely under-estimated because we mostly see the larger ones with ISIIS, and they are not the dominant ones in the Mediterranean. Still, it echoes nicely a recent Nature paper by Tristan Biard (a contributor to PlanktonPortal’s talk, under the username Collodaria), which showed that Rhizaria (a large taxonomic group to which Radiolarians belong) can be equivalent in biomass to Copepods, who were previously thought to largely dominate the plankton. These findings were also based on in situ images, because these fragile Rhizaria cannot be collected with nets.
Finally, the images in the Mediterranean were collected along transects (i.e. straight lines) perpendicular to the shore. We were interested in how organisms were distributed along a gradient between coastal and open ocean conditions. In the plots below, the coast is on the left, the open ocean on the right and the vertical direction is depth (top: surface; bottom: 100 m depth). So you basically see a “slice” of water along which ISIIS undulated. The size of the dots is proportional to the number of classifications recorded. You can immediately notice that Doliolids (first plot) are concentrated near the surface, and fish larvae (second plot) even more so! This is a surprising finding for fish larvae, which sometimes ended up in concentrations of over 10 individuals per cubic meter, a number much higher than what was previously observed elsewhere, with conventional plankton nets.
Radiolarian colonies, on the opposite, tend to be concentrated in mid water (see figure below). Within this messy picture, some structure seems to emerge. Indeed, the white lines on top of the plot are contours of the concentration of Chlorophyll A in the water (i.e. of the amount of unicellular algae). If you look carefully, you will see that those lines are moving up, towards the surface, as we travel offshore (from left to right on the plot). This is actually well known in this region. What is interesting is that the radiolarians seem so follow the same pattern, and that higher concentrations of colonies sit on top of this high Chlorophyll region. Something is definitely going on between these two!
That’s it for now — thanks again to everyone for this wonderful year of activity! We apologise for not being as active as we would like to be on Talk. To that end, we thank the active moderators who take over this important responsibility. And finally, we thank Zooniverse for the great opportunity and community they created. Now, on to next year!